Trading Update: Friday April 19, 2024
S&P Emini pre-open market analysis
Emini daily chart
- The Emini formed five consecutive bear bars below the moving average. This is a sign of strong selling and increases the odds of lower prices and a test of the 5,000 round number.
- The market will likely test down to the 5,000 big round number (which it did during the Globex Session).
- The 5,000 round number is such an important price level that the market will have a hard time escaping the gravitational pull of it.
- There will probably be profit-taking at the 5,000 round number, and the market will likely bounce for a few days, as the round number will likely act as support.
- The bears want to get down to the January 5th low, the bottom of the bull channel.
- The daily chart is now in a trading range and is near the midpoint of the bull channel. This increases the risk that the bears selling at this price level could suffer a deep pullback before they get a second leg down.
- The bulls are hopeful that the current selloff will lead to a major high lower and a reversal up to the All time high. More likely, the Bears are going to get a second leg down.
- Overall, traders should expect the market to go sideways, and the downside will likely be limited for the next day or two.
Emini 5-minute chart and what to expect today
- Emini is down 6 points in the overnight Globex session.
- The Globex Market sold off to the 5,000 big round number late last night and found support.
- Traders have been expecting a test of 5,000, and the odds favored reaching it soon.
- The news will argue that last night’s selloff was due to Israel’s retaliation attack on Iran and fears of a Global War. While the recent bombings could be the catalyst for the selloff, the reality is that traders expected a pullback and were not willing to buy until the market reached the magnet of 5,000. If there are not enough traders willing to buy, the market will quickly race down to a price level where bulls will be willing to buy again, which in this case is 5,000.
- Because the reversal up from 5,000 is strong, traders will expect the downside today to be limited.
- This will reduce the odds of today becoming a bear trend day and increase the chances of a bull trend or a trading range day.
- As always, traders should expect the open to have a lot of sideways trading. Most traders should consider not trading for the first 6-12 bars unless they can make quick decisions since most breakouts fail.
- The most important thing on the open is to be patient and not in a rush to do anything. By waiting on the open, a trader gains certainty above the outcome of the day.
- Today is Friday, so the weekly chart is important. Traders should be prepared for a surprise breakout late in the day as traders decide on the close of the weekly chart.
Yesterday’s Emini setups

Al created the SP500 Emini charts.
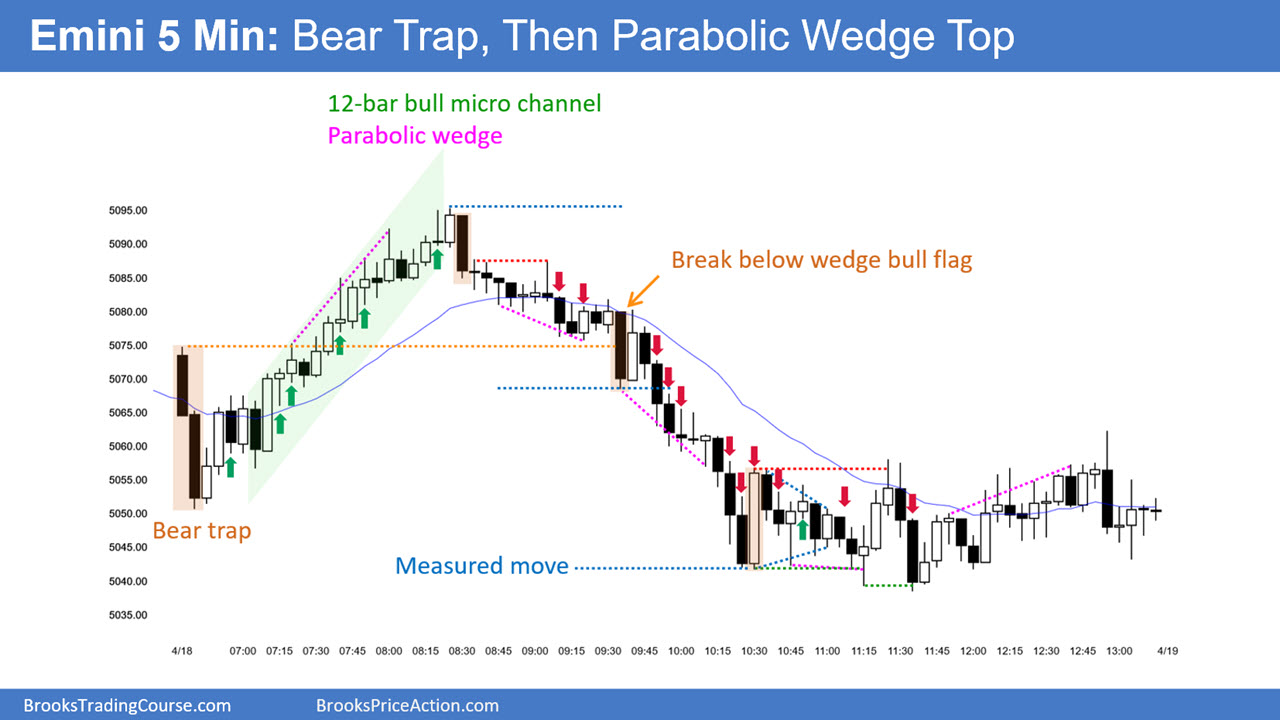
Here are reasonable stop entry setups from yesterday. I show each buy entry bar with a green arrow and each sell entry bar with a red arrow. Buyers of both the Brooks Trading Course and Encyclopedia of Chart Patterns have access to a near 4-year library of more detailed explanations of swing trade setups (see Online Course/BTC Daily Setups). Encyclopedia members get current daily charts added to Encyclopedia.
My goal with these charts is to present an Always In perspective. If a trader was trying to be Always In or nearly Always In a position all day, and he was not currently in the market, these entries would be logical times for him to enter. These therefore are swing entries.
It is important to understand that most swing setups do not lead to swing trades. As soon as traders are disappointed, many exit. Those who exit prefer to get out with a small profit (scalp), but often have to exit with a small loss.
If the risk is too big for your account, you should wait for trades with less risk or trade an alternative market like the Micro Emini.
EURUSD Forex market trading strategies
EURUSD Forex daily chart
- A chart of EURUSD will be posted soon.
- The EURUSD formed a Low 1 short yesterday and is finding buying below it, which was expected.
- Low 1s are always a variation of a double bottom, and double bottoms always have disappointed bears buying back shorts. Low 1s often lead to pullbacks, followed by an attempt at trend resumption later.
- Because the daily chart of the EURUSD is in an overall trading range, traders are paying close attention to the April 2nd breakout point low. Bulls expect this breakout point to get tested and closed, allowing them to make money.
- As strong as last week’s selloff was, the risk of a 2nd leg bear trap is real. The more buying pressure the bulls are able to build, the greater the risk of a 2nd leg trap.
- The bears are hopeful that if today is a bull reversal bar, it will find sellers above, leading to a second entry sell (Low 2).
- The bears are still in control, and the bulls need to do more if they want to reverse last week’s selloff.
- The bulls want today to close on its high, creating a strong bull reversal bar, and the bears will try their best to create a tail above today’s high. This means traders should pay attention to a possible reversal later in the day, disappointing the bulls and creating a tail above the bar.
Summary of today’s S&P Emini price action
Al created the SP500 Emini charts.
End of day video review
End Of Day Review will be presented in the Trading Room today. See below for details on how to sign up.
See the weekly update for a discussion of the price action on the weekly chart and for what to expect going into next week.
Trading Room
Al Brooks and other presenters talk about the detailed Emini price action real-time each day in the BrooksPriceAction.com trading room days. We offer a 2 day free trial.
Charts use Pacific Time
When times are mentioned, it is USA Pacific Time. The Emini day session charts begin at 6:30 am PT and end at 1:15 pm PT which is 15 minutes after the NYSE closes. You can read background information on the market reports on the Market Update page.

