Market Overview: Crude Oil Futures
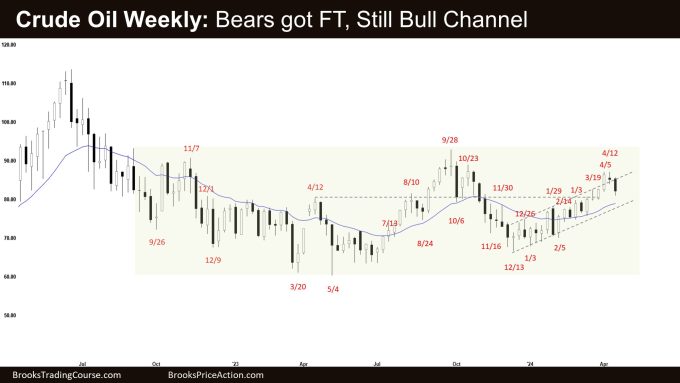
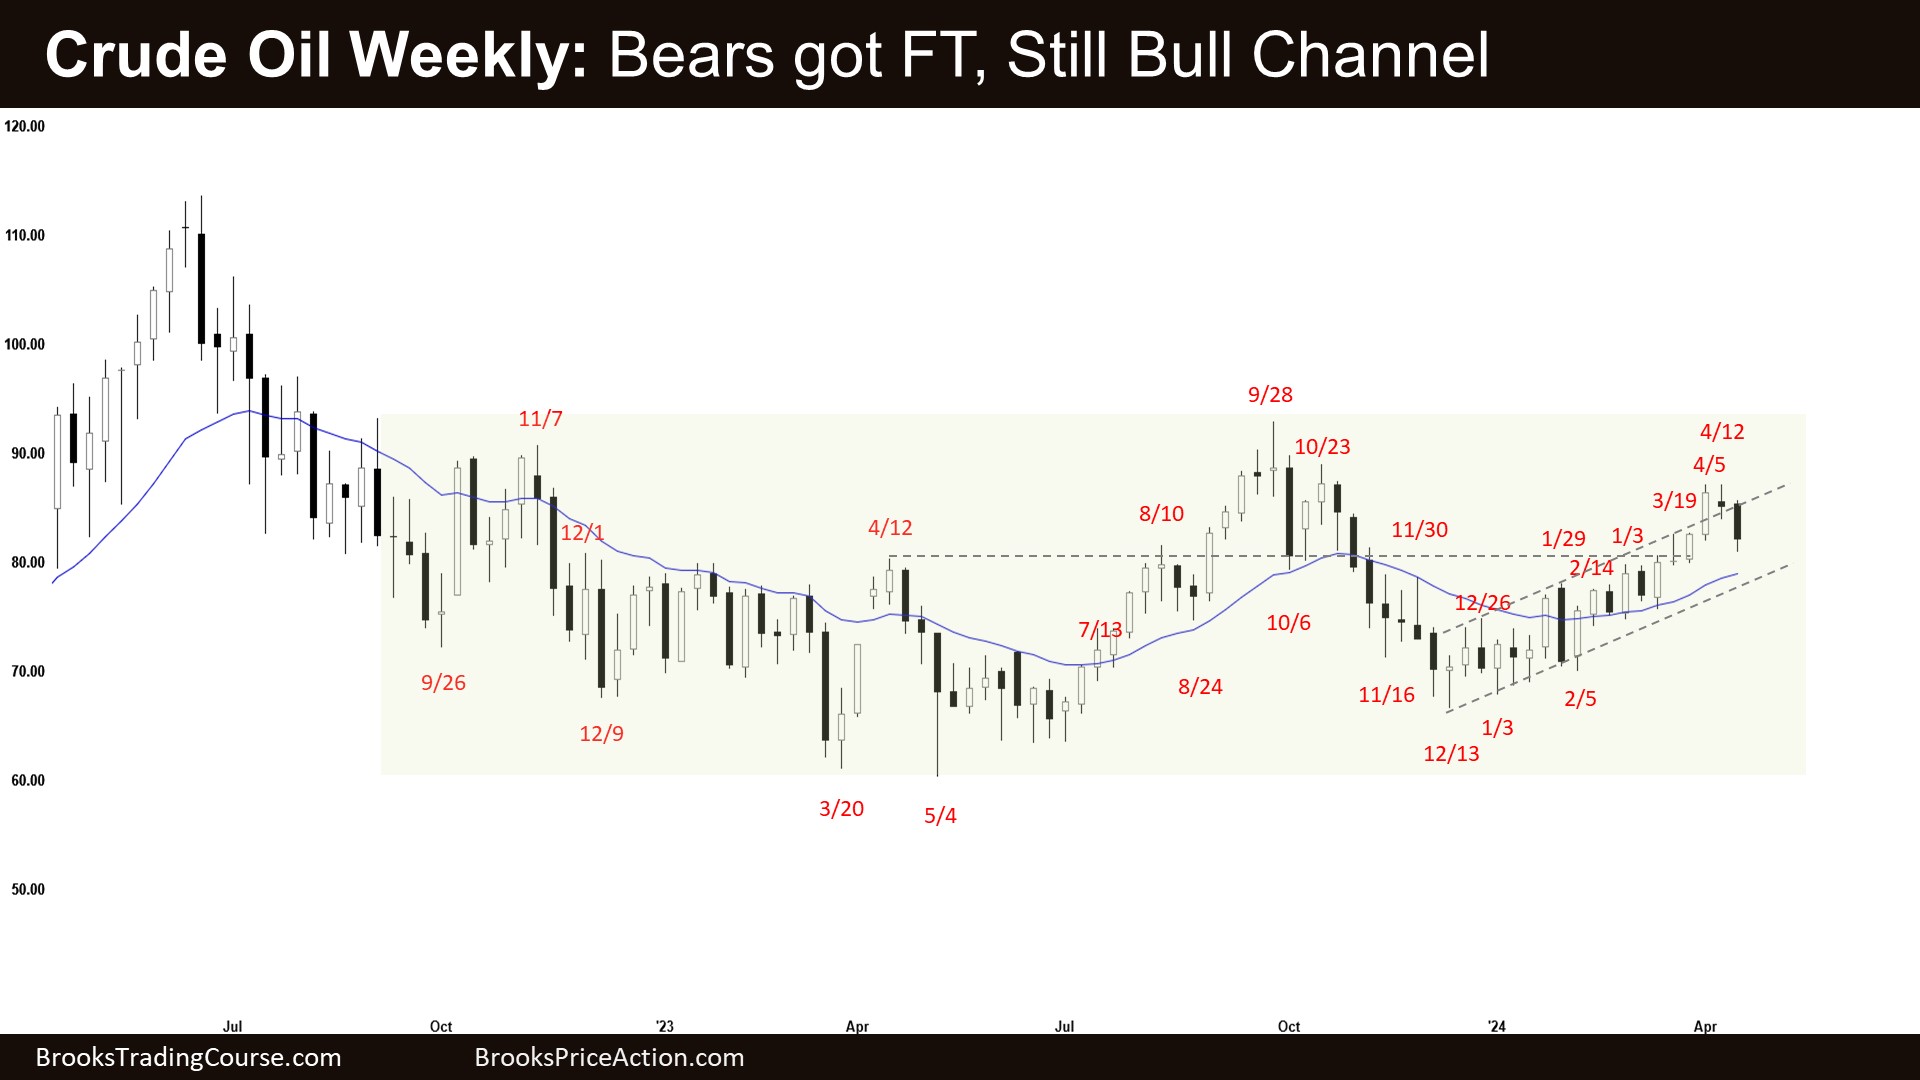
The weekly chart formed a Crude Oil pullback closing as a bear bar with a prominent tail below. The bears will need to create consecutive bear bars closing near their lows to convince traders that they are back in control. If the market trades lower, the bulls want the 20-week EMA or the bull trend line to act as support.
Crude oil futures
The Weekly crude oil chart

- This week’s candlestick on the weekly Crude Oil chart was a bear bar with a prominent tail below.
- Last week, we said that the odds slightly favor the market to remain in the bull channel with pullbacks in between. Traders will see if sellers appear around this area, or higher up in the trading range.
- The bears see the bull leg as forming a wedge bear flag (Dec 26, Jan 29, Apr 12). They also see an embedded wedge in the third leg up (Jan 3, Mar 19, and Apr 12).
- They want a failed breakout above the bull channel.
- They will need to create consecutive bear bars closing near their lows to convince traders that they are back in control.
- If the market trades higher, they want it to stall around the April 12 high area, forming a small double top.
- The bulls got a weak bull leg with overlapping candlesticks trading above the 20-week EMA testing the upper third of the large trading range.
- They want a retest of the September 28 high after the current pullback.
- If the market trades lower, the bulls want the 20-week EMA or the bull trend line to act as support.
- Since this week’s candlestick is a bear (with a prominent tail below), it is a sell signal bar for next week.
- For now, the market may still be in the sideways-to-down pullback phase.
- Until the bears can create a strong breakout below the bull trend line and the 20-week EMA, the odds slightly favor the market to remain in the bull channel with pullbacks in between.
- The market is trading near the upper third of the trading range, which is the sell zone of the trading range traders.
- Traders will see if sellers appear around this area aggressively, or higher up in the trading range.
- Traders will see if the bears can create a strong follow-through bear bar, something they have not been able to do since December.
The Daily crude oil chart

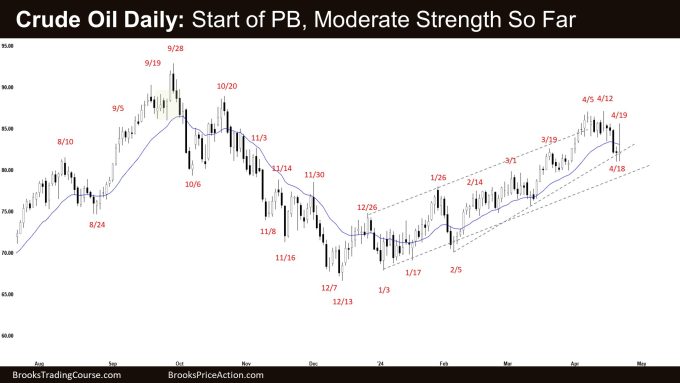
- The market traded sideways earlier in the week and broke lower on Wednesday with limited follow-through selling. Friday traded higher but closed as a doji with a long tail above, closing below the 20-day EMA.
- Last week, we said that the move-up is strong enough to favor at least a small second leg sideways to up after a slightly larger pullback.
- Is Friday a 1-bar small second leg sideways to up to retest the prior trend extreme high (Apr 12)?
- The bulls hope that the bull leg to retest the trading range high (Sept 28) is currently underway.
- They want the current pullback to be weak and shallow (filled with bull bars, doji(s) and overlapping candlesticks).
- They want the 20-day EMA or the bull trend line to act as support.
- The bear sees the move up as forming a wedge bear flag (Dec 26, Jan 26, and Apr 12). They also see an embedded wedge forming in the third leg up (Mar 1, Mar 19, and Apr 5) and a small double top (Apr 5 and Apr 12).
- They see the move up simply as a bull leg within a trading range and a buy vacuum test of the trading range high area.
- The problem with the bear’s case is that the selling pressure is not yet as strong as the bear’s hope it would be.
- They need to create strong consecutive bear bars trading far below the 20-day EMA and the bear trend line to increase the odds of the bear leg beginning.
- For now, the market may still be in the sideways-to-down pullback phase.
- The prior move-up is strong enough to favor at least a small second leg sideways to up after a slightly larger pullback.
- The market is also trading near the upper third of the trading range, which can be the sell zone of trading range traders.
- Traders will see if sellers appear aggressively here, and if not, then the next area to watch for is around the September 28 high area.
Market analysis reports archive
You can access all weekend reports on the Market Analysis page.

