
Trading Update: Wednesday May 17, 2023
S&P Emini pre-open market analysis
Emini daily chart

- The Emini is in a tight trading range, a breakout mode pattern and the Emini continues to disappoint traders betting on breakouts.
- The bears got a bear reversal bar closing on its low yesterday.
- However, just like all the other bars over the past two weeks, it is in the middle of a tight trading range. This makes a stop entry short below yesterday a low-probability trade.
- Traders should assume the probability of a breakout up or down is close to 50%.
- Eventually, there will be a breakout and a measured move of the month-long trading range.
- Until there is a clear breakout with follow-through, traders should assume that most breakouts will fail.
- The bears want to test the May 4th high since there are likely tapped bears who sold and scaled in higher. The bulls got trapped buying the May 1st high and likely scaled in lower.
- The most important thing on the daily chart is realizing that the market is in breakout mode and is oscillating around the 20-period exponential moving average blue line. Eventually, there will be a breakout; however, as Al often says: “Until there is a breakout, there is no breakout.”.
Emini 5-minute chart and what to expect today
- Emini is up 13 points in the overnight Globex session.
- Since the market is in a tight trading range on the daily chart, traders should expect trading range price action during the U.S. Session until proven otherwise.
- As I often say, most traders should wait for 6-12 bars before placing a trade. It is important to realize that I say this as a guideline. Most opens have much trading range price action, making it easy to get trapped on the wrong side, betting on a breakout.
- By waiting for 6 – 12 bars, trading is gaining certainty on the type of day.
- In general, there is a 20% chance that bar 1 is the high or low of the day. The is around a 50% chance that bar 6 is either the high or the low of the day, and by bar 18, there is around a 90% chance that either the high or the low of the day has formed.
- There is often an opening swing that begins before the end of the second hour and often starts before the end of the second hour and typically after the formation of a double top/bottom or a wedge top/bottom.
- Lastly, traders should pay close attention to the day’s open. If the day is going to be a trading range, the day’s open will likely repeatedly be a magnet, similar to yesterday.
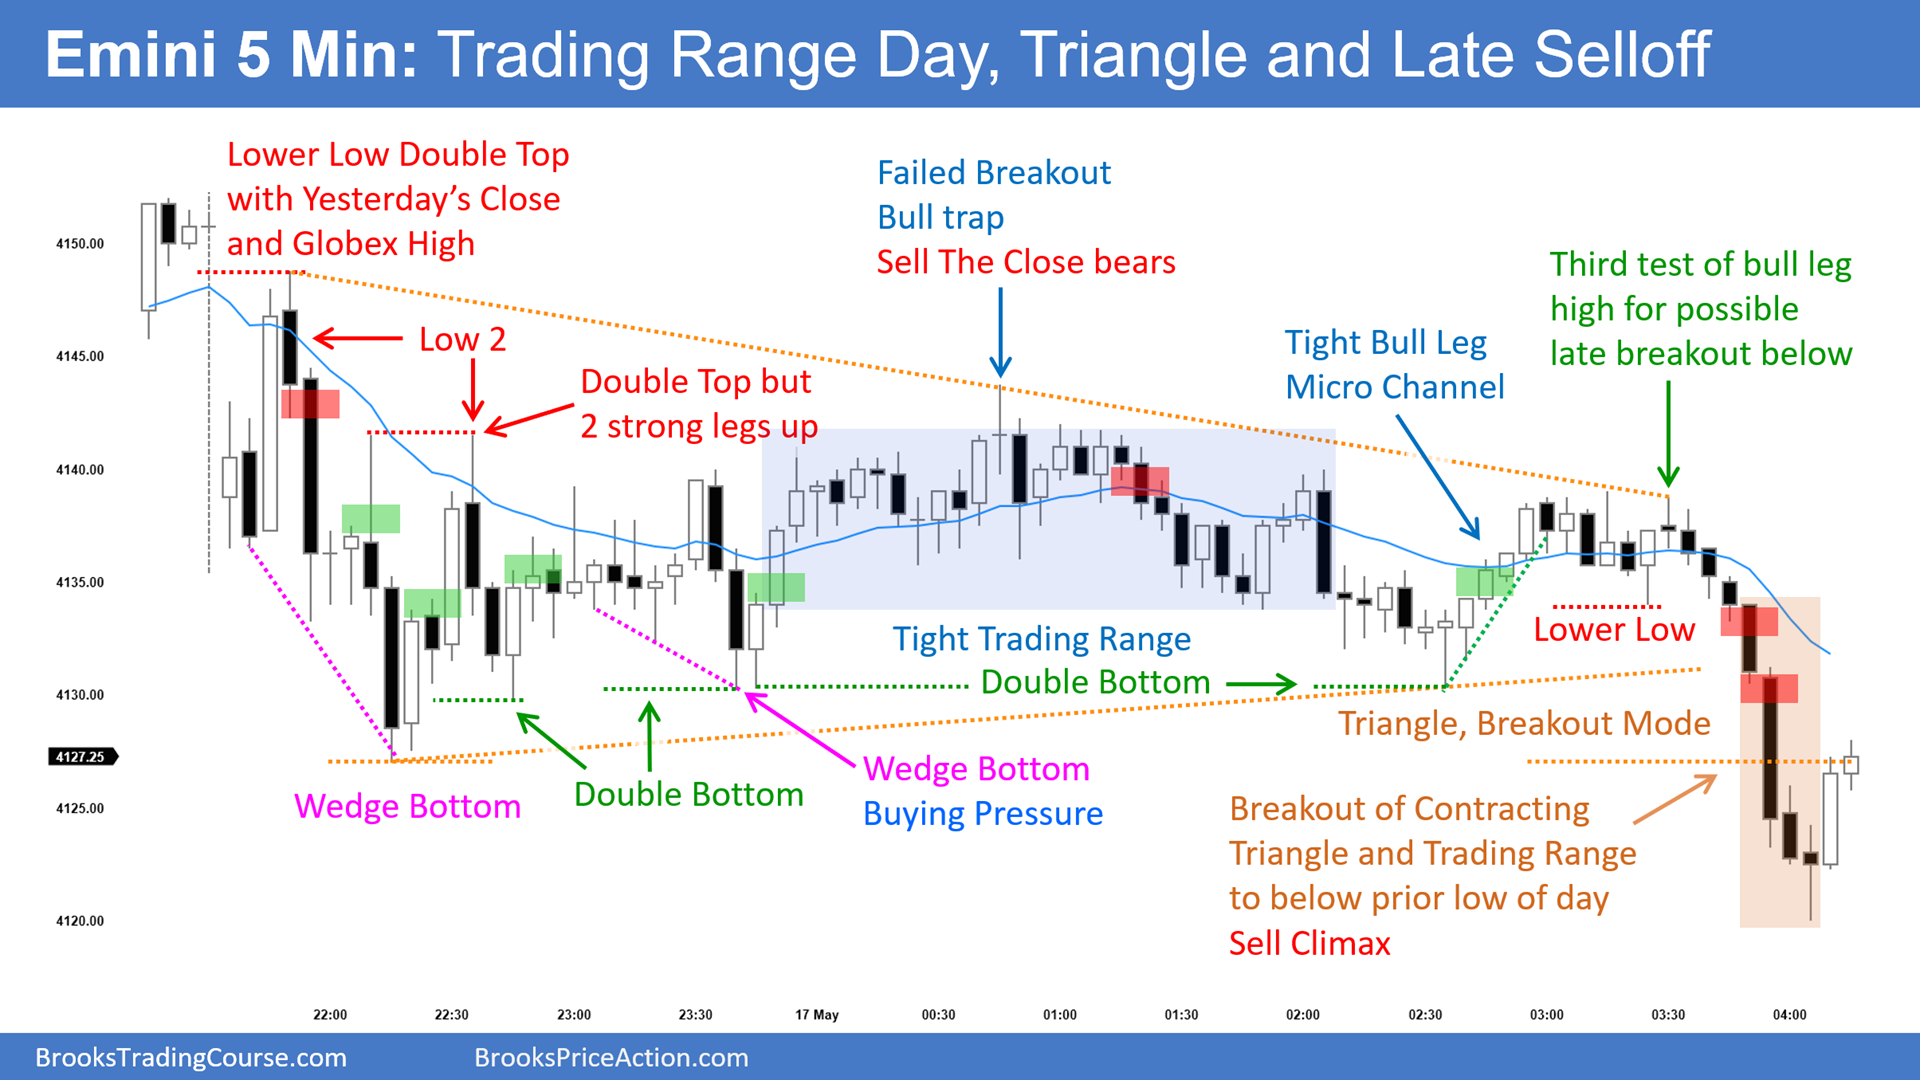
Emini intraday market update
- The Emini formed a trend from the open on bar 1.
- Yesterday’s low is a target for the bears as it is a credible sell signal on the daily chart. The bears want to get a strong downside breakout below yesterday’s low and have today form a strong entry bar.
- The bulls want to prevent the bears from getting below yesterday’s low. I suspect the market will test below yesterday’s low to see if there are more buyers or sellers.
- Since the market is in a Tight Trading Range on the daily chart, traders must be aware that any day can lead to a strong breakout and trend day.
- The market reversed up on bar 7 after testing yesterday’s close. The bulls want an opening reversal and a test of the open of the day. The bears want the market to form a lower high and test back down to the low of bar 7. The rally from bar 7-9 increases the odds that this market is forming a trading range and not a bear trend.
- Bar 13 the market has formed a 7 bar bull Micro Channel, after forming a 7 bar bear Micro Channel down to bar 7. This is Trading Range behavior.
Yesterday’s Emini setups
Richard created the SP500 Emini chart.
Here are several reasonable stop entry setups from yesterday. I show each buy entry with a green rectangle and each sell entry with a red rectangle. Buyers of both the Brooks Trading Course and Encyclopedia of Chart Patterns have access to a near 4-year library of more detailed explanations of swing trade setups (see Online Course/BTC Daily Setups). Encyclopedia members get current daily charts added to Encyclopedia.
My goal with these charts is to present an Always In perspective. If a trader was trying to be Always In or nearly Always In a position all day, and he was not currently in the market, these entries would be logical times for him to enter. These therefore are swing entries.
It is important to understand that most swing setups do not lead to swing trades. As soon as traders are disappointed, many exit. Those who exit prefer to get out with a small profit (scalp), but often have to exit with a small loss.
If the risk is too big for your account, you should wait for trades with less risk or trade an alternative market like the Micro Emini.
EURUSD Forex market trading strategies
EURUSD Forex daily chart
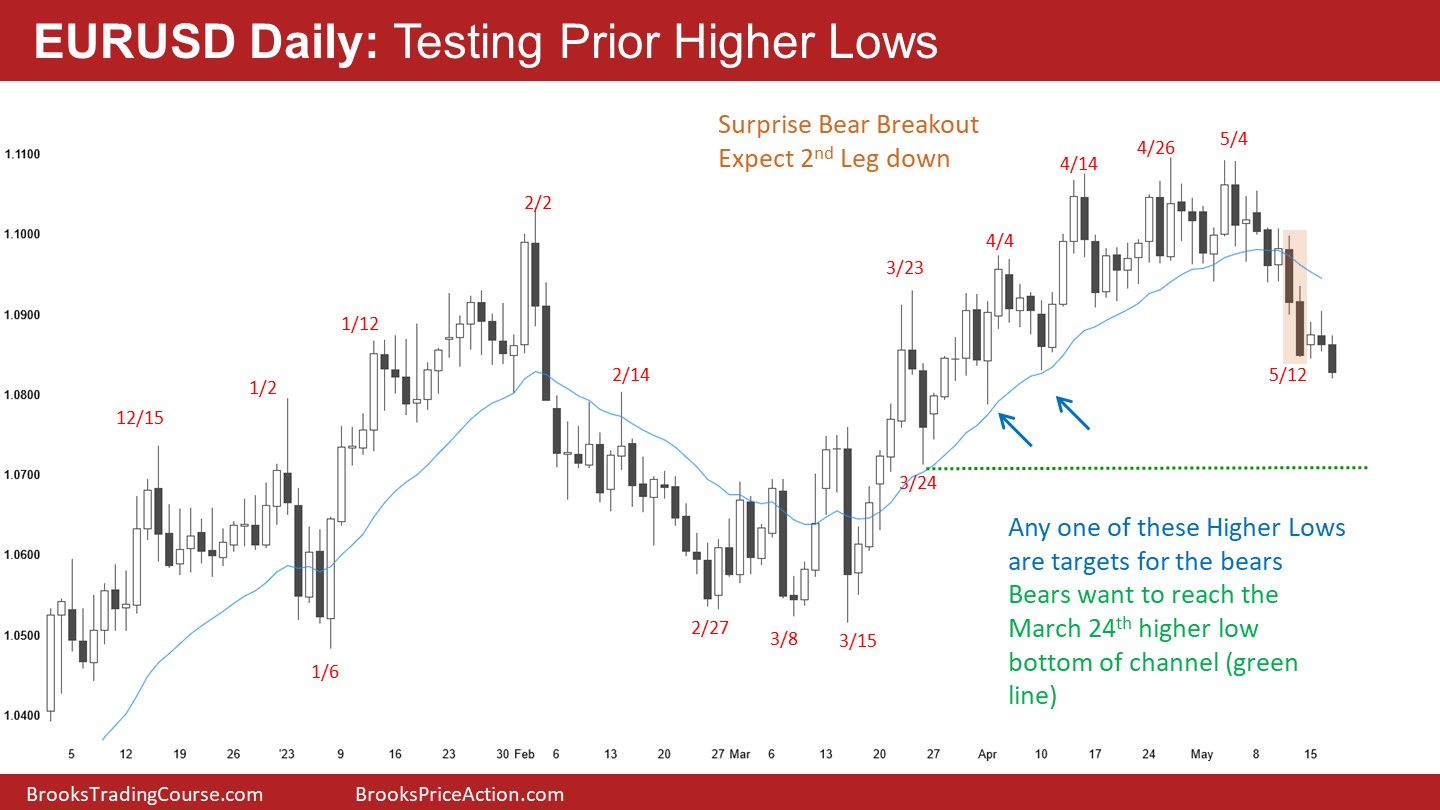
- The EURUSD is testing prior higher lows of the bull channel that began on March 24th.
- The bears got a strong breakout with follow-through on May 12th. This was a strong enough surprise that the odds favor a 2nd leg down and lower prices.
- While the market is Always In Short, the market is likely transitioning from a bull channel into a trading range.
- This means that any one of these higher lows could be support and lead to a failed breakout.
- The bears want to break below the March 15th low and get a measured move down the year-long trading range. More likely, the year is going to continue to go sideways.
- Since the market is Always In Short, traders should expect more sideways to down.
- The bulls must establish more buying pressure before reversing the downside breakout (May 12th).
- Until the bulls collect more buying pressure, the odds favor lower prices and a test of the March 24th low (green line).
Summary of today’s S&P Emini price action
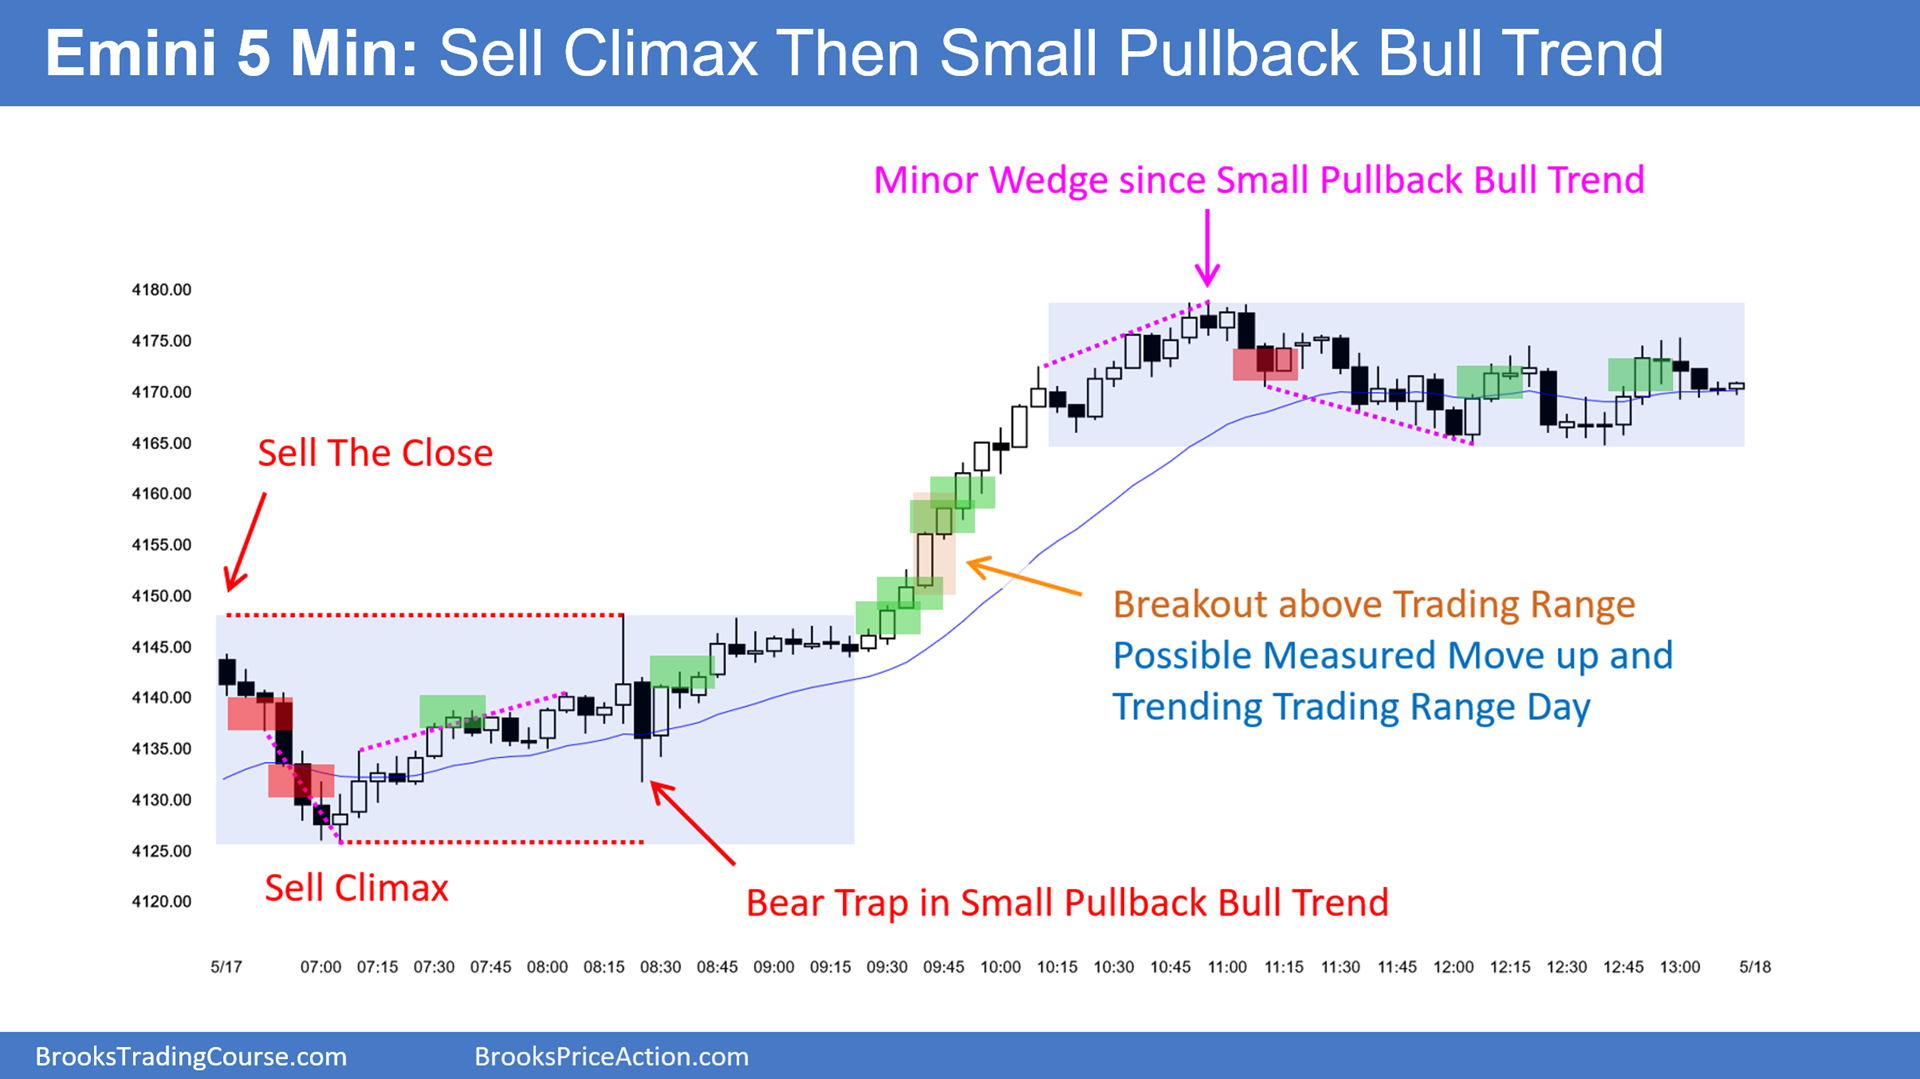
Al created the SP500 Emini chart.
End of day video review
Live stream video review with Brad Wolff. Here is YouTube link:
Emini End of Day Video Review for Wednesday May 17, 2023
See the weekly update for a discussion of the price action on the weekly chart and for what to expect going into next week.
Trading Room
Al Brooks and other presenters talk about the detailed Emini price action real-time each day in the BrooksPriceAction.com trading room days. We offer a 2 day free trial.
Charts use Pacific Time
When times are mentioned, it is USA Pacific Time. The Emini day session charts begin at 6:30 am PT and end at 1:15 pm PT which is 15 minutes after the NYSE closes. You can read background information on the market reports on the Market Update page.