Trading Update: Wednesday May 24, 2023
S&P Emini pre-open market analysis
Emini daily chart
- The Emini formed a triangle and broke above the May 1st high; however, the bears overpowered the bulls, and the market reversed yesterday. The reversal down yesterday is strong enough that market will see likely test of triangle apex and the low of May 17th (bottom of the bull breakout).
- The bulls formed a high 1 buy with Monday’s close. However, it was a high 1 buy at the top of a trading range, which lowers the probability for the bulls.
- The bears had a strong bear breakout yesterday. Next, they want today to have strong follow-through and be another big bear bar closing on its low.
- The bulls will try to prevent the bears from getting another strong bear breakout bar today.
- There are currently trapped bulls who bought the May 22 low. Those bulls are deciding what to do here. They are probably disappointed enough that they will exit on any test of the May 22nd low. This means that there are probably sellers at the May 22nd low.
- Overall, the bulls are trapped, and the bears can get a strong follow-through bar today or tomorrow. If the bears can get a follow-through today or tomorrow, the probability will increase for lower prices. More likely, today will disappoint both the bulls and the bears.
Emini 5-minute chart and what to expect today
- Emini is down 20 points in the overnight Globex session.
- The overnight Globex market sold off after yesterday’s strong bear channel down.
- Today will probably have at least two hours of sideways trading since yesterday’s selloff was climactic. This means traders should expect the open to have a lot of trading range trading.
- Most traders should wait for 6-12 bars unless they are comfortable with limit orders.
- There is a greater than an 80% chance that a swing trade will happen before the end of the second hour. This means that traders should focus on catching the opening swing that often happens after forming a double top/bottom or a wedge top/bottom.
- Traders should expect a trading range day but be open to a possible trend day since the bears will try and get follow-through after yesterday’s bear trend.
Emini intraday market update
- The Emini Sold off and formed a bear trend from the open.
- While the selloff was strong, it was likely to evolve into a trading range.
- In general, there is a 50% chance of an initial reversal of the opening move and an 80% chance of at least a minor reversal.
- The bulls began to develop decent buying pressure during bars 9-20. Although the buying pressure was not strong, it was enough to transition the market into a likely trading range and halt the selling.
- The bulls got a strong reversal up above the moving average at 8:25 AM PT. Although the channel up was tight, the odds favored a trading range, more than a strong bull trend, so traders had to be prepared for a possible deep pullback.
- As of bar 37 (9:35 AM PT) the bulls have a lower low, major trend reversal setup.
- There is an FOMC report at 11:00 AM PT, which means most traders should be flat at least 30 minutes going into the report.
- Lastly, during the FOMC report, traders should consider not trading until the close of the 2nd bar after the report. FOMC reports are often big and have lots of reversals, so traders must remember to trade small. In general, a good rule of thumb is to trade a 20% position size.
Yesterday’s Emini setups

Al created the SP500 Emini charts.
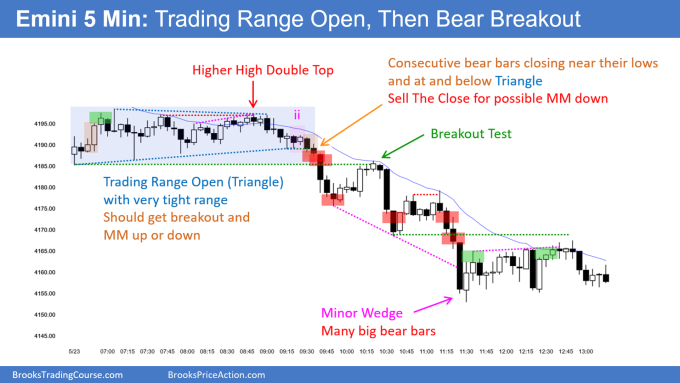
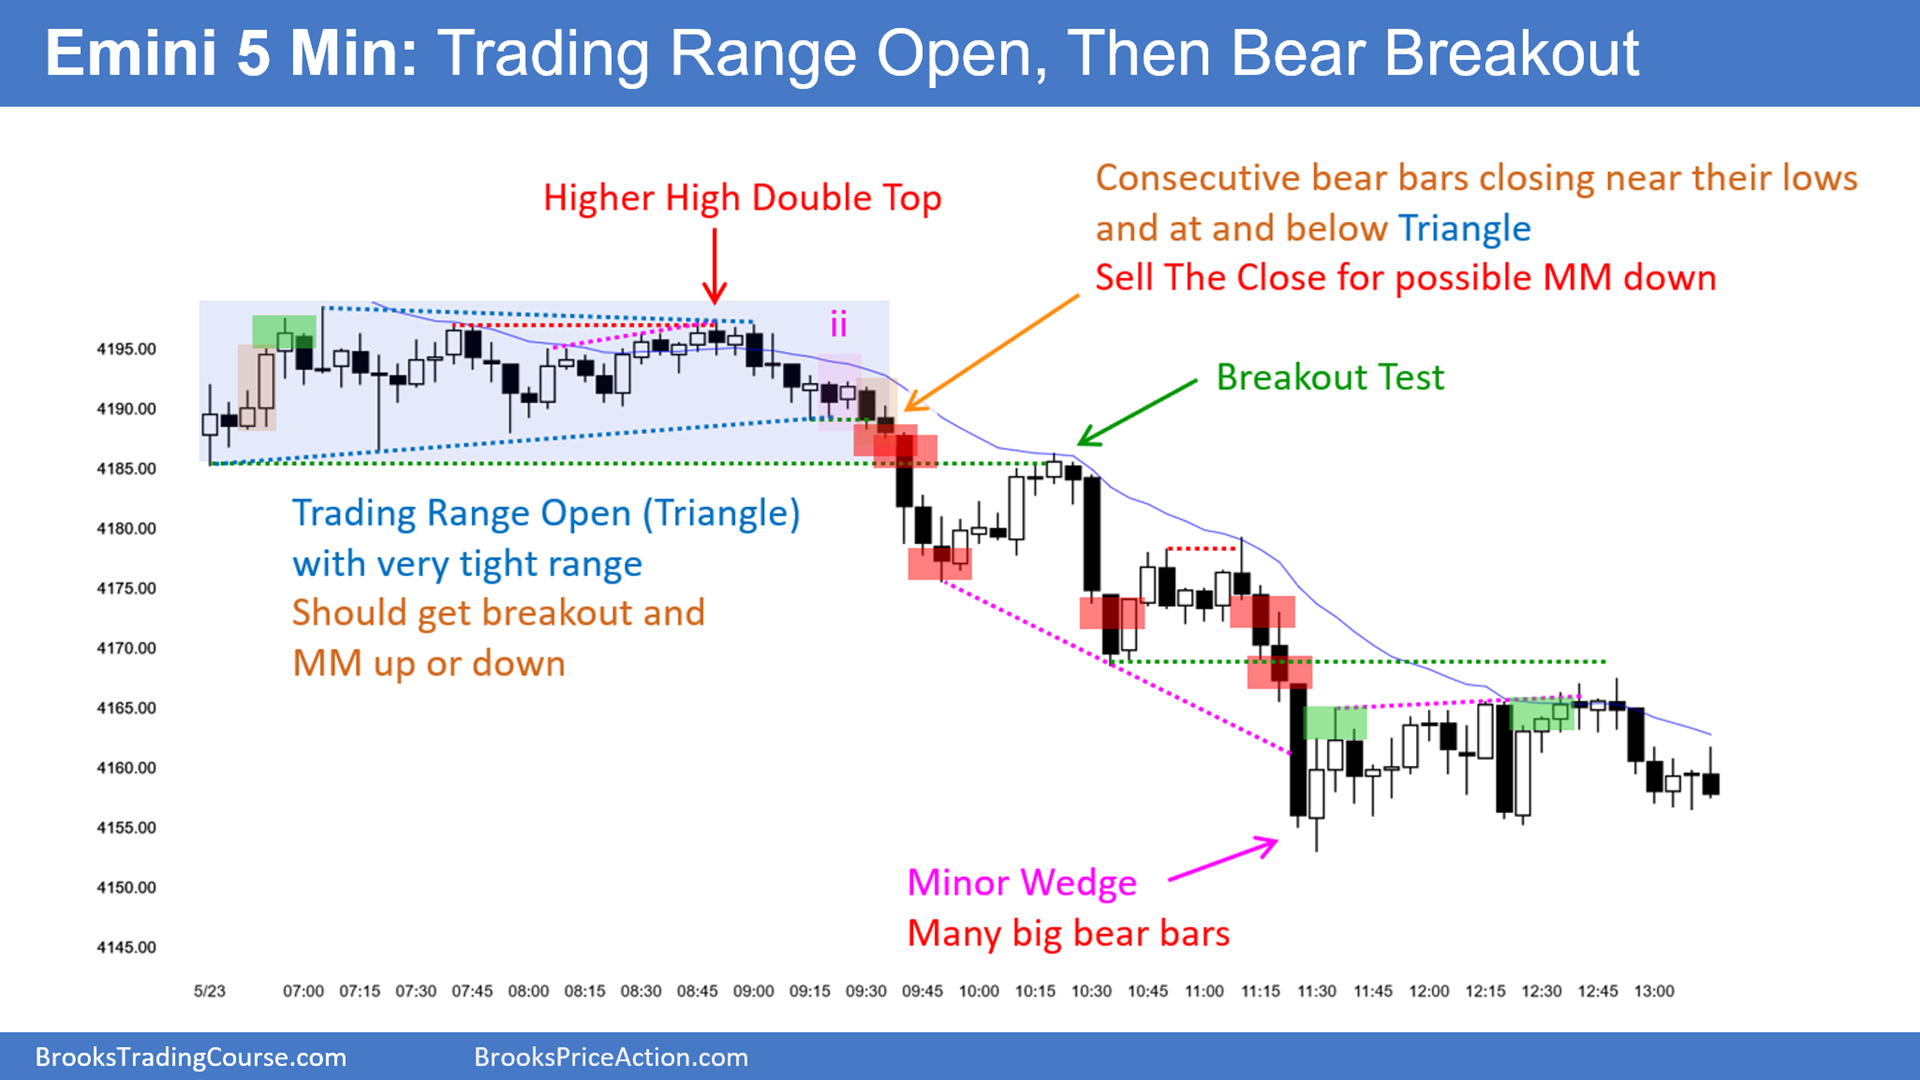
Here are several reasonable stop entry setups from yesterday. I show each buy entry with a green rectangle and each sell entry with a red rectangle. Buyers of both the Brooks Trading Course and Encyclopedia of Chart Patterns have access to a near 4-year library of more detailed explanations of swing trade setups (see Online Course/BTC Daily Setups). Encyclopedia members get current daily charts added to Encyclopedia.
My goal with these charts is to present an Always In perspective. If a trader was trying to be Always In or nearly Always In a position all day, and he was not currently in the market, these entries would be logical times for him to enter. These therefore are swing entries.
It is important to understand that most swing setups do not lead to swing trades. As soon as traders are disappointed, many exit. Those who exit prefer to get out with a small profit (scalp), but often have to exit with a small loss.
If the risk is too big for your account, you should wait for trades with less risk or trade an alternative market like the Micro Emini.
EURUSD Forex market trading strategies
EURUSD Forex daily chart

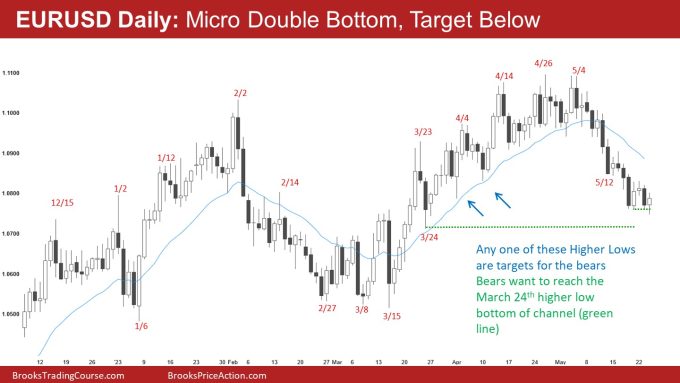
- The overnight Globex Market sold off after yesterday’s strong bear channel down.
- Today will probably have at least two hours of sideways trading since yesterday’s selloff was climactic. This means traders should expect the open to have a lot of trading range trading.
- Most traders should wait for 6-12 bars unless they are comfortable with limit orders.
- There is a greater than an 80% chance that a swing trade will happen before the end of the second hour. This means that traders should focus on catching the opening swing that often happens after forming a double top/bottom or a wedge top/bottom.
- Traders should expect a trading range day but be open to a possible trend day since the bears will try and get follow-through after yesterday’s bear trend.
Summary of today’s S&P Emini price action
Al created the SP500 Emini charts.
End of day video review
Live stream video review with Brad Wolff. Here is YouTube link:
Emini End of Day Video Review for Wednesday May 24, 2023
See the weekly update for a discussion of the price action on the weekly chart and for what to expect going into next week.
Trading Room
Al Brooks and other presenters talk about the detailed Emini price action real-time each day in the BrooksPriceAction.com trading room days. We offer a 2 day free trial.
Charts use Pacific Time
When times are mentioned, it is USA Pacific Time. The Emini day session charts begin at 6:30 am PT and end at 1:15 pm PT which is 15 minutes after the NYSE closes. You can read background information on the market reports on the Market Update page.

