

Ethereum price started a decent increase above the $1,870 resistance against the US Dollar. ETH could attempt an upside break above the key $1,920 resistance.
- Ethereum is slowly attempting a recovery wave from the $1,840 support zone.
- The price is trading above $1,870 and the 100-hourly Simple Moving Average.
- There was a break above a key bearish trend line with resistance near $1,870 on the hourly chart of ETH/USD (data feed via Kraken).
- The pair could start a strong increase if it clears the $1,880 and $1,900 resistance levels.
Ethereum Price Holds Support
Ethereum’s price managed to stay above the $1,840 support. ETH formed a base and recently started a recovery wave from the $1,838 low, similar to Bitcoin.
There was a break above the $1,870 resistance level. The price climbed above the 23.6% Fib retracement level of the downward move from the $1,916 swing high to the $1,838 low. Besides, there was a break above a key bearish trend line with resistance near $1,870 on the hourly chart of ETH/USD.
Ether is now trading above $1,870 and the 100-hourly Simple Moving Average. There are also chances of a short-term inverse head and shoulders pattern on the same chart. Immediate resistance is near the $1,880 zone. The next major resistance is near the $1,885 level or the 61.8% Fib retracement level of the downward move from the $1,916 swing high to the $1,838 low.
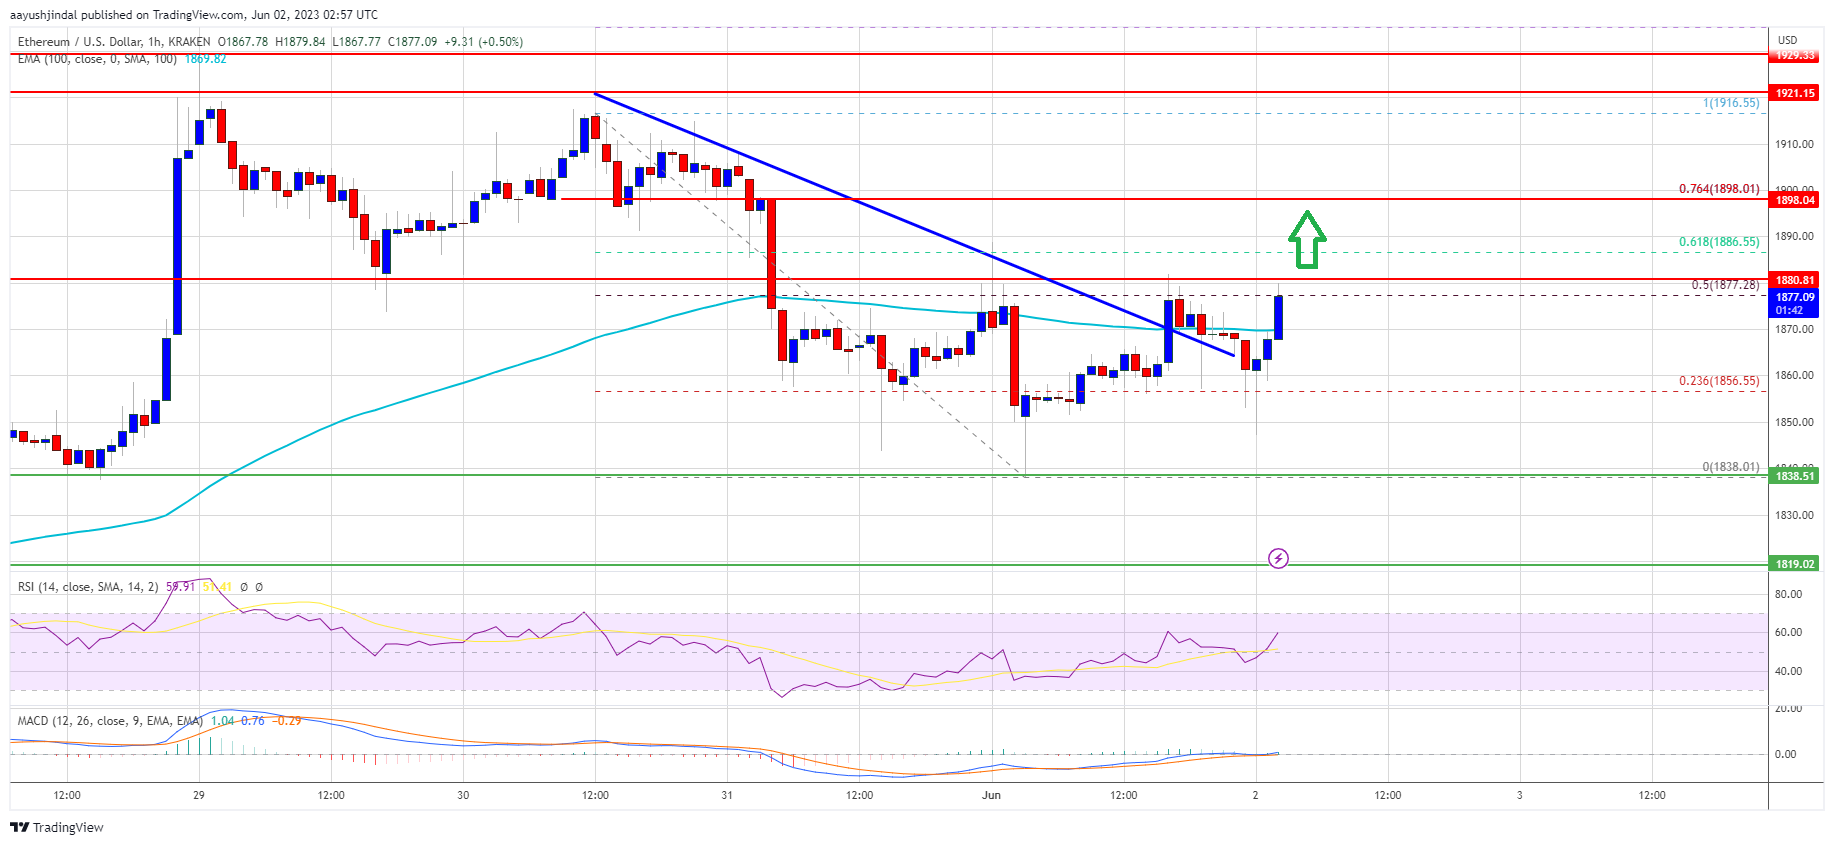
Source: ETHUSD on TradingView.com
A proper move above the $1,880 and $1,885 resistance levels might send Ether toward $1,920. The next resistance sits near $1,940, above which Ethereum could rise toward $2,000. Any more gains above the $2,000 resistance zone might send the price toward the $2,120 resistance.
Fresh Decline in ETH?
If Ethereum fails to clear the $1,880 resistance, it could start another decline. Initial support on the downside is near the $1,870 level and the 100-hourly Simple Moving Average.
The next major support is near the $1,855 zone. If there is a break below the $1,855 support, the price could decline toward the $1,840 support. Any more losses may perhaps send the price toward the $1,800 level or even $1,740 in the coming sessions.
Technical Indicators
Hourly MACD – The MACD for ETH/USD is gaining momentum in the bullish zone.
Hourly RSI – The RSI for ETH/USD is above the 50 level.
Major Support Level – $1,840
Major Resistance Level – $1,880