Market Overview: EURUSD Forex
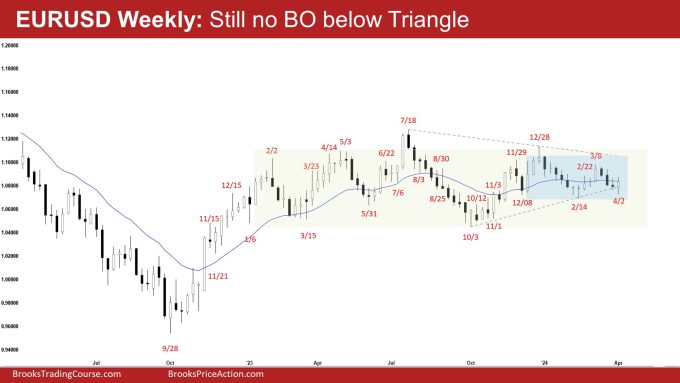
On the weekly chart, there was still no EURUSD breakout below the triangle. The bulls want a reversal from a double bottom bull flag (Feb 14 and Apr 2) or a wedge bull flag (Dec 8, Feb 14, and Apr 2). The bears hope that this week was simply a pullback and hope to get at least another small leg to retest the March 29 low.
EURUSD Forex market
The Weekly EURUSD chart

- This week’s candlestick on the weekly EURUSD Forex chart was a bull bar with a prominent tail above closing in its upper half and around the 20-week EMA.
- Last week, we said that the odds slightly favor the market to trade at least a little lower. Traders will see if the bears can create a breakout below the triangle or will the market trade slightly lower but find support around the bull trend line area.
- The market traded lower earlier in the week but found support around the bull trend line area.
- Previously, the bears got a reversal from a wedge bear flag (Nov 3, Nov 29, and Dec 28) and a lower high major trend reversal (Dec 28).
- They then got another leg down from a lower high major trend reversal (Mar 8).
- So far, they have not yet been able to create a strong breakout from the triangle pattern.
- They hope that this week was simply a pullback and hope to get at least another small leg to retest the March 29 low.
- The bulls got a 2-legged sideways to up pullback (Mar 8) from a double bottom bull flag (Dec 8 and Feb 14).
- They see that the current move is simply a pullback and want a retest of the March 8 high followed by a breakout above.
- They want a reversal from a double bottom bull flag (Feb 14 and Apr 2) or a wedge bull flag (Dec 8, Feb 14, and Apr 2) and want the 20-week EMA or the bull trend line to act as support.
- Since this week’s candlestick was a bull bar closing in its upper half, it is a buy signal bar for next week albeit weaker (prominent tail above).
- The bulls need to create a follow-through bull bar closing above the 20-week EMA to increase the odds of a retest of the March High.
- The market is trading around the middle of the trading range which can be an area of balance.
- For now, traders will see if the bulls can create a follow-through bull bar or will the market continue to stall around the 20-week EMA area.
- Poor follow-through and reversals are hallmarks of a trading range.
- The EURUSD is in a 71-week trading range. (Trading range high: July 2023, Trading range low: Oct 2023).
- The EURUSD has been in a smaller trading range in the last 21 weeks.
- Traders will continue to BLSH (Buy Low, Sell High) within a trading range until there is a breakout with follow-through selling/buying.
The Daily EURUSD chart

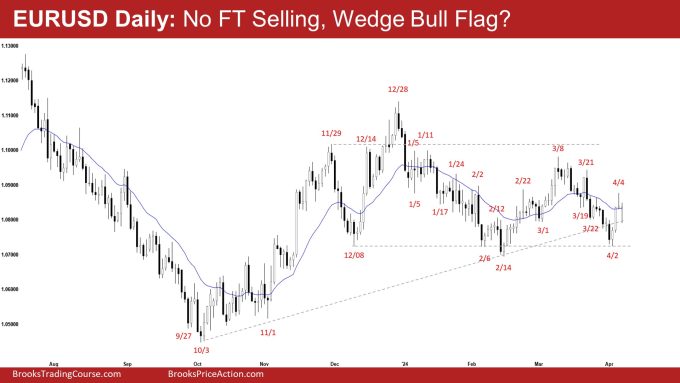
- The EURUSD traded lower earlier in the week but reversed higher from Tuesday onwards. Thursday and Friday were consecutive doji(s) trading around the 20-day EMA.
- Previously, we said that the odds slightly favor the market to trade at least a little lower. Traders will see if the bears can create follow-through selling below the bull trend line or not.
- While the market has traded below the bull trend line, the bears have not yet been able to create a strong breakout with follow-through selling.
- Previously, the bulls got a TBTL (Ten Bars, Two Legs) pullback forming a lower high (Mar 8).
- They hope to get another leg up from a double bottom bull flag (Feb 14 and Apr 2) or a wedge bull flag (Dec 8, Feb 14, and Apr 2).
- They want the 20-day EMA or the bull trend line to act as support. So far, the bull trend line is acting as support.
- The bulls want a retest of the March 8 high followed by a strong test and breakout above the bear trend line.
- The bears see the recent move (to March 8) simply as a two-legged pullback and a buy vacuum test of the small trading range high area.
- They got a reversal from a lower high major trend reversal (Mar 8) and a double top bear flag (Jan 11 and Mar 8).
- They want a retest of the February 14 low (even if it only ends up as a higher low). They got what they wanted and the retest formed a higher low (Apr 2).
- If the market trades higher, the bears hope to get a reversal from a double top bear flag with the March 8 high.
- For now, traders will see if the bulls can create follow-through buying following this week’s close above the 20-day EMA.
- The EURUSD has been trading in a smaller trading range in the last 21 weeks. This week, the market reversed higher from around the low of the smaller trading range.
- The market is also trading around the middle of the larger trading range which could be an area of balance.
- Poor follow-through and reversals are hallmarks of a trading range.
- Traders will continue to BLSH (Buy Low, Sell High) within a trading range until there is a breakout with follow-through selling/buying.
Market analysis reports archive
You can access all weekend reports on the Market Analysis page.

