

The shooting star price action pattern is a bearish signal that signifies a higher probability of the market moving lower than higher and is used primarily in down trending markets. In essence, it is the opposite of the hammer pattern. Here is an example of what a shooting star candle looks like:
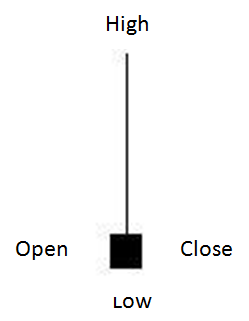
A shooting star shows buyers pushing the market to a new high. However, the buyers are not strong enough to stay at the high and choose to bail on their positions. This causes the market to fall lower, leading sellers to also step into the market. The open and close price levels should both be in the lower half of the candle. Traditionally, the close can be above the open but it is a stronger signal if the close is below the opening price level.
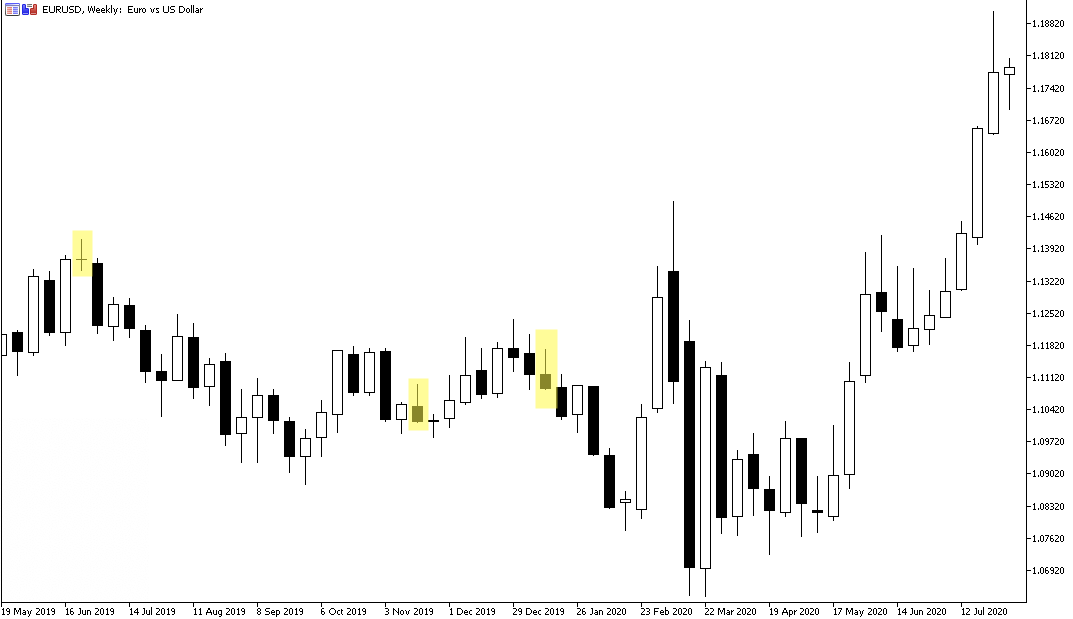
In the above price action forex chart of EUR/USD, there are three examples of a shooting star pattern – all highlighted in the gold boxes. Through the analysis of the open, close, high and low price levels the pattern suggests a move lower is likely. In these examples, price did move lower after the candles formed. Again, this is not guaranteed to happen and if you look closely you will see examples in the same chart where the price did not move lower. How could you have traded it?
THE ENTRY: A possible price level to enter a trade, could be when the market finally manages to break the low of the shooting star candle. The low of the third shooting star candle – which formed on the week of 12 January 2020 – is 1.1086. Therefore, an entry price could be 1.1085.
THE STOP-LOSS: A possible stop loss level could be at the high of the shooting star candle. With the high of the shooting star candle at 1.1171, a possible stop loss could be 1.1173.
THE TARGET: There are multiple ways to exit a trade in profit such as exiting on the close of a candle if the trade is in profit, targeting levels of support or resistance or using trailing stop losses. In this instance targeting the previous swing low level would result in a target price of 1.0981.
THE TRADE: With an entry price of 1.1085 and stop loss of 1.1173 the total risk on the trade is 88 pips. Trading at 0.1 lot would mean that if this trade triggered the entry price, then hit the stop loss, the overall loss would be $88. In this instance, the market traded lower to reach the target price resulting in an approximate trade profit of $104.
Learn more about price action trading and other trading related topics by subscribing to our channel.